Brexit promised a better Britain. A decade on, the numbers tell a different story. Al Jazeera breaks it down.
On June 23, 2016, exactly 10 years ago, a close referendum saw just over half of Britons vote to leave the European Union (EU) after years of campaigning that Britain would be better off outside the bloc.
A decade on, the promises made during the referendum campaign have largely failed to materialise. Research suggests the UK economy is smaller than it would have been, migration is higher, and compared to its peers, the UK is falling behind.
list 1 of 3Net migration to the UK falls by nearly 50 percent amid tighter policies
list 2 of 3In Britain, Brexit is debated again as Starmer’s grip on power slips
list 3 of 3Political turmoil: UK will see its seventh prime minister in 10 years
Here are seven charts to explain Brexit and how it has played out.
To understand Brexit, you have to go back long before the vote and trace how the UK’s relationship with Europe evolved.
In 1973, driven by sluggish economic growth, Britain joined the European Economic Community (EEC), a six-member economic trading bloc. According to data from the Centre for Economic Policy Research (CEPR), Britain’s GDP per capita was almost 30 percent higher than that of the EEC nations in 1950, yet by 1973 it was roughly 10 percent lower.
Scepticism about deeper integration with Europe never went away in the decades that followed – and it was never confined to the right. Labour’s 1983 general election manifesto had called for withdrawal from the EEC, reflecting a left-wing view of the bloc as a barrier to socialism, before the party reversed course after its landslide defeat that year.
By the early 2010s, pressure from Eurosceptic MPs within Prime Minister David Cameron’s own Conservative Party, amplified by the rising electoral threat of Nigel Farage’s UK Independence Party (UKIP), pushed Cameron into a political gamble: a promise to hold a referendum on EU membership if he were re-elected.
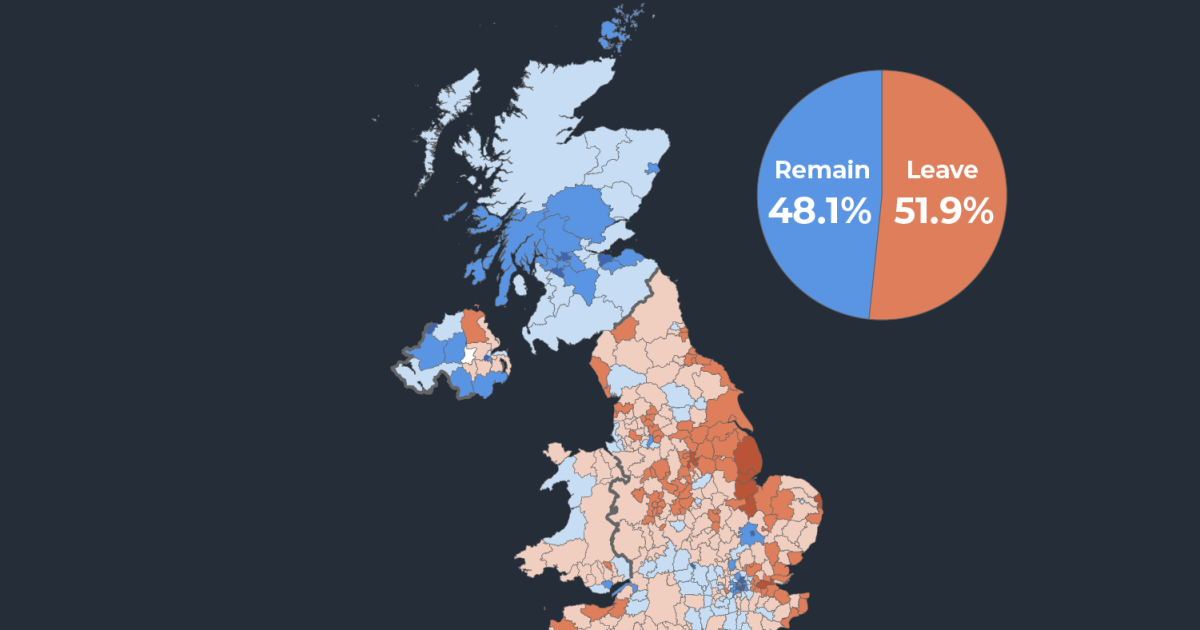
On June 23, 2016, the vote was held, but the result did not go as planned.
Overall: 51.9 percent voted to leave, 48.1 percent voted to remain
Smaller towns and rural areas tended to vote Leave, while major cities tended to vote Remain.
The referendum split British politics down the middle, and visibly within Cameron’s own cabinet. Cameron led the Remain campaign alongside Chancellor George Osborne, backed by most of the Conservative Party, the Labour Party, the Liberal Democrats and the Scottish National Party.
On the Leave campaign, senior Conservative members such as Boris Johnson and Michael Gove, both cabinet ministers, backed the Brexit vote. Nigel Farage, whose party had pushed for the referendum in the first place, campaigned heavily for Brexit and later founded the Brexit Party, now Reform UK, in 2018.
After the Leave vote, Cameron resigned, and Theresa May took over the task of delivering Brexit, but failed to get her withdrawal deal through parliament in 2019. Boris Johnson succeeded her and oversaw the UK’s departure from the EU on January 31, 2020.
Over the past decade, real GDP per capita – the total value of all goods and services produced in the UK, adjusted for inflation, per person – has lagged that of the EU’s 27 members.
By 2025, the UK was running five index points behind the bloc on the same 2016 baseline. Economists project average annual growth of just 1.3 percent between 2026 and 2030, reflecting the ongoing drag of trade barriers and structural change.
Business investment in the UK also paints a similar picture. UK companies pulled back sharply after the 2016 vote, with some studies putting the investment shortfall compared to a non-Brexit scenario at 12 to 18 percent – a gap driven largely by years of political and regulatory uncertainty that delayed corporate decision-making.
According to the Office for Budget Responsibility, Brexit has made the country less productive by about four percent.
According to the Office for Budget Responsibility, trade with Europe is on course to be about 15 percent lower in the long run, with trade deals with non-EU countries not making a meaningful difference.
Leaving the EU meant leaving a system in which goods moved freely across borders without checks, certificates or delays.
Under the current EU-UK Trade and Cooperation Agreement (TCA), British firms exporting to Europe must prove where their products are made, retest goods already certified in the UK and manage paperwork that did not exist before 2021. Food exporters must comply with physical border inspections and businesses handling data have to comply with two sets of rules in the EU and UK.
According to HSBC Global Investment Research, border checks alone have cost the UK £4.7bn ($5.9bn) up to 2024. Sanitary controls on food trade cost traders about £54m ($71.5m) every year. While larger businesses have been able to absorb the burden, smaller businesses have not, and have in some cases stopped selling to the EU altogether.
Within hours of the Leave result becoming clear, the pound fell more than 10 percent against the dollar, dropping from $1.48 to as low as $1.32. At the time, it was the largest single-day drop in modern history, reaching levels that had not been seen since 1985.
A weaker pound made imports more expensive, pushing up prices for British consumers. As Britain runs a large trade deficit – importing more than it exports – it relies heavily on foreign investment to balance the books. As trade barriers have weighed on growth, that investment has looked less attractive, keeping pressure on the currency.
Investment banks, uncertain about the UK’s future relationship with the EU, began relocating operations to mainland Europe.
Ten years on, the pound has not returned to pre-Brexit levels. While it has recovered from its lowest points, it remains constrained by structural changes as a result of leaving the EU.
Migration has not come down in the way the Leave campaign had promised. The UK regained control of its borders, replacing free movement for EU citizens with a points-based immigration system. The effect on EU migration was stark – net long-term migration balance with the EU was negative by 2022, meaning more EU nationals left than arrived.
But lower EU migration did not lead to lower overall migration. Net arrivals from non-EU countries surged in its place, pushing total net migration to a record high in 2023.
Numbers have since fallen following tighter rules introduced in 2025, but remain above where they stood before Brexit.
While the UK was a member of the EU, thousands of European regulations applied automatically in UK law. After Brexit, they were copied into UK law – all 6,800 pieces to prevent a legal vacuum.
A decade on, only a third have been amended or repealed. The government passed a special fast-track law – Retained EU Law (Revocation and Reform) Act – to help speed up the changes, but that is set to expire on June 23, 2026, which means any further divergence from EU rules will go through a slower, parliamentary process.
However, leaving the EU did allow Britain to pass laws it could not introduce as an EU member. These included banning the export of live animals for slaughter, taking back control of its territorial waters by ending the EU’s Common Fisheries Policy, and scrapping VAT on women’s sanitary products.
During the 2016 referendum, the country was fairly split. A decade on, opinion has shifted significantly.
According to a June 2026 YouGov poll, 57 percent of Britons now believe leaving the EU was the wrong decision versus 30 percent who believe it was the right thing to do. A separate Ipsos poll found that 52 percent of Britons think the UK should apply to rejoin the EU.
About two-thirds of 18- to 24-year-olds – many of whom were too young to vote at the time – say they would vote to rejoin, compared with little more than a third of those over 65.
Source: https://www.aljazeera.com/news/2026/6/23/brexit-10-years-on-what-has-changed-in-the-uk-explained-in-maps-and-charts?traffic_source=rss